Step by step guide for using Python in Power BI
- Apr 1, 2022
- 3 min read
Updated: Aug 10, 2022
In the fast-paced world of the information era it has become increasingly important to understand your data assets and how to leverage your data asset so that it works for you. With the use of Python in Power BI, business users can effectively make data driven decisions by leveraging machine learning and predictive analytics. In this article we will present a step-by-step guide to help the user to enable Python scripting in Power BI, importing data, creating visuals, and training a machine learning model.

Let’s get some background
Being able to share reports and have them easily accessible allows business users to make valuable and informed decisions when required. We enable Predictive and Prescriptive insights into your data by adding Machine Learning into our dashboards.
So why use Power BI?
For 14 consecutive years, Gartner has recognized Microsoft as a Magic Quadrant Leader in analytics and business intelligence platforms. It scores high in completeness of vision and ability to execute. That is why it is the trusted BI tool for many organizations in the world and it makes impressive dashboards. With continued updates, Power BI users now can leverage Python for the use of Data Science!
Let’s get configured
Step 1: Ensure an instance of Python and any relevant packages installed on your local machine. If you don’t already have Python installed, you can find it here.
Step 2: Enable Python in Power BI by ensuring it is pointing to your Python installation (File -> Options and Settings -> Options -> Python scripting)
For this instance, we will be using Power BI Desktop, however, should you wish to publish your dashboard to Power BI Service, there is currently on-going support and it can execute python script except for some limitations.
Let’s get loaded
As a demonstration I will be utilizing the Iris data set which can be found from UCI’s Machine Learning Repository. The data can be loaded by either importing the data using python scripting or by simply importing the data using Power BI’s import functionality. It is important to note that Power BI only recognizes Python Dataframes as valid datasets and vice versa.
In this example we will be importing our data using Python scripting.
In Power BI we navigate to Home -> Get Data -> Other -> Python script. The Python scripting window will open which allows you to enter your code and do your manipulations with the data before importing the data.

After clicking “OK”, your python script will execute, and the navigator will appear where you would have to select any relevant python dataframes that were created from your script.

Once you click “Load”, your data will be present within your Power BI model!
Let’s see what’s going on.
We’ve just loaded data into Power BI using Python. Now, we are going to get started on creating some visuals in Power BI leveraging some fancy Python packages, namely, Matplotlib and Seaborn.
We get started by selecting the Python visual from the Visualizations panel, enabling script visuals, selecting the required data fields, and scripting the visual you would like displayed on your dashboard.

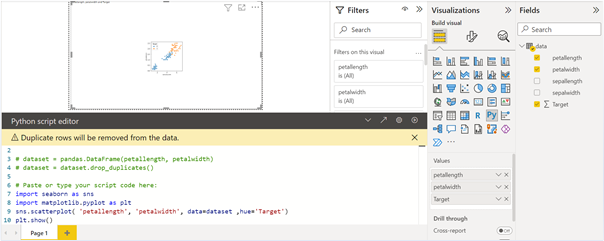
After repeating the above for the sepal dimension and making amendments to make the dashboard more visually pleasing, we end up with something like this.

This is awesome. We are now able to visualize the Iris data in Power BI using Python plots!
Let’s get Data Science
You might be asking yourself, “Surely Python can do more than just visuals in Power BI?”. If that was what you were thinking then you were right, Python can do so much more.
With Python in Power BI we have the ability to train a Machine Learning model and score data within Power BI. For this example, I used scikit-learn packages and reproduced a model with its relevant metrics within my dashboard. You will find code for the SVM model and ROC curve here.

We have now successfully trained a model that can with a degree of accuracy predict the Iris Viginica species of Iris flower based on length and width dimensions of its sepal and petal.
Let’s get excited!
What does this mean for the Data Scientist and what does this mean for the business user.
The Data Scientist can now effectively monitor the performance of models in production and will know when it is the right time to recalibrate or re-model their solution. Not only this, but Power BI acts as an effective tool for Data Scientists to communicate their models to their business users with it’s enticing visuals and storytelling functionality.
Data Scientists can enable business users with forecasting and predictive analytics within their dashboards, allowing business users to make more data driven decisions daily.
In conclusion
The need for Data Science solutions within organizations is exponentially increasing around the world. With the use of BI tools that allow for embedded Data Science solutions organizations are now able to enable their business users with analytical power at their fingertips.
Michael Bennett
Data & Analytics Consultant


Comments